Excel VBA 「カー計簿」円グラフ
Excel VBA 「カー計簿」円グラフ作成
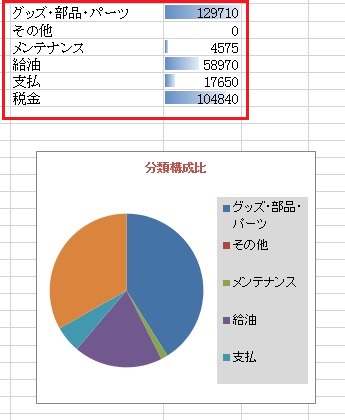
単純な数字の羅列ではなく、グラフ化して視覚的に分かりやすい図形を印刷物(帳票)に貼り付けます。
円グラフ作成イメージ

円グラフ作成のソースリスト
|
1 2 3 4 5 6 7 |
Sub DelChart1xlPie() ActiveSheet.ChartObjects("Chart1").Activate Selection.Delete End Sub |
|
1 2 3 4 5 6 7 8 9 10 11 12 13 14 15 16 17 18 19 20 21 22 23 24 25 26 27 28 29 30 31 32 33 |
Private Sub AddChart1xlPie() Dim ChartObj As Object Dim wk_Line As Long wk_Line = Cells(Rows.Count, 10).End(xlUp).Row '最終行取得 With ActiveSheet.Shapes.AddChart.Chart .ChartType = xlPie .SetSourceData Range(Cells(2, 10), Cells(wk_Line, 11)) 'レンジ範囲:2行目10列目から最終行取得まで End With Set ChartObj = ActiveSheet.ChartObjects(1) With ChartObj .Name = "Chart1" 'グラフの名前を設定 .Top = 140 '表示位置 .Left = 600 '表示位置 .Width = 225 '幅 .Height = 200 '高さ With .Chart .HasTitle = True 'タイトル設定 .ChartTitle.Text = "分類構成比" 'タイトル文字列 With .ChartTitle.Format.TextFrame2.TextRange.Font .Size = 10 'タイトル文字サイズ .Fill.ForeColor.ObjectThemeColor = 6 'タイトル文字色 End With .HasLegend = True '凡例表示 .Legend.Position = xlLegendPositionRight '凡例表示位置(右側) With ChartObj.Chart.Legend.Format.Fill .Visible = msoTrue '塗りつぶし設定 .ForeColor.RGB = RGB(217, 217, 217) '色指定 End With End With End With End Sub |


